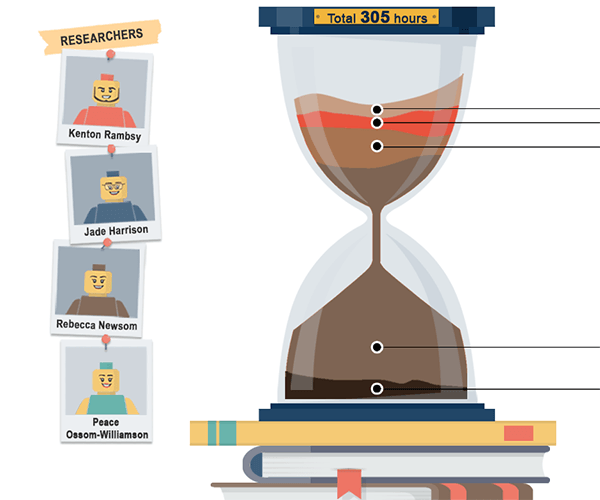
#vizoftheweek 6: Labor and Digital Humanities
Have you ever seen a digital humanities project that interested you, but you didn’t know what it took to create it? This #vizoftheweek breaks down…
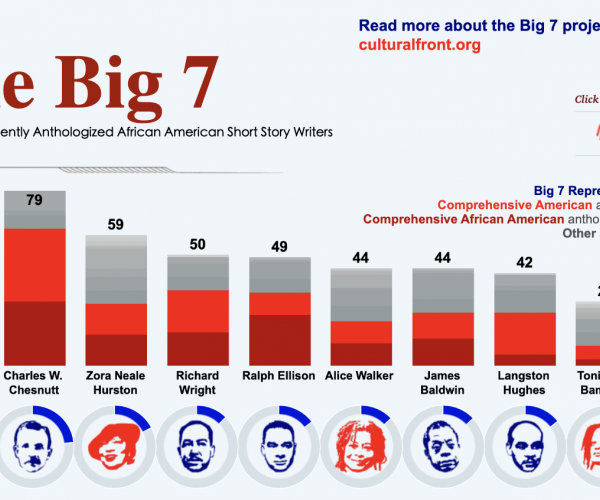
#vizoftheweek 5: Quantifying the Circulation History of African American Short-Story Authors
Standard literary histories, which emphasize key dates and moments, sometimes minimize subtle but important developing patterns, which take shape…
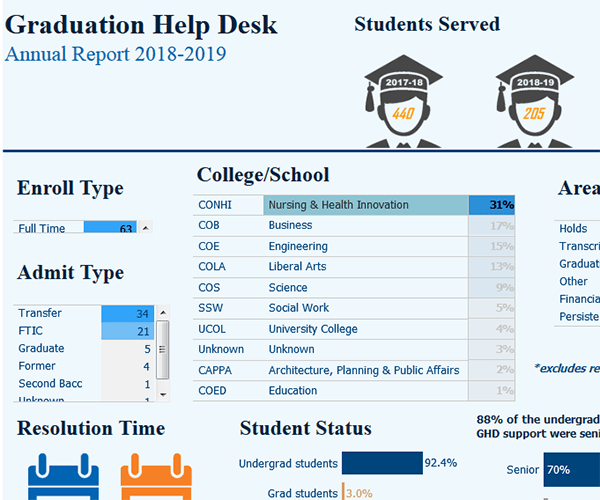
#vizoftheweek 4: UTA Has a Team That Will Help You Graduate
The Graduation Help Desk provides services to all undergraduate students and can help you overcome barriers to graduating on time, including any…
Data Structuring for DH Mapping
But what is a dataset in the humanities? Can you make one? If you think about “data” as meaning “information,” yes, you can.
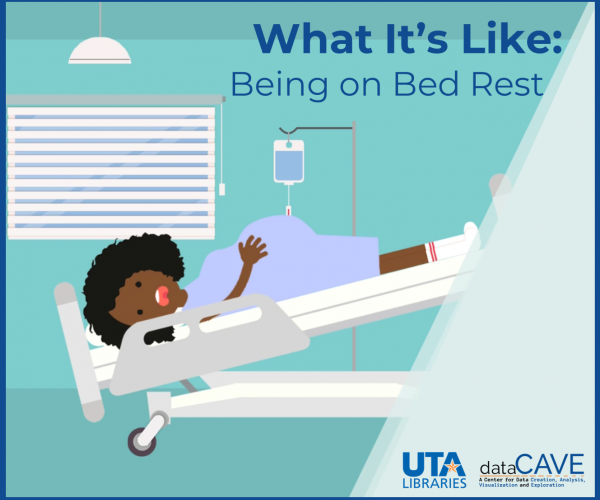
#vizoftheweek 3: What It's Like - Bed Rest
Using one person's story this visual video shows the impact of bed rest on an entire community.
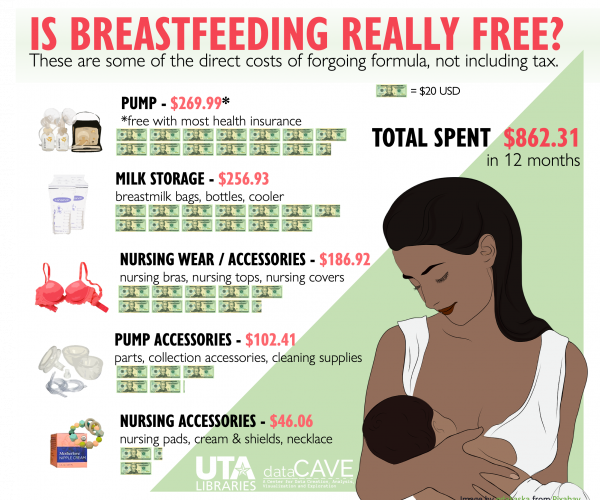
#vizoftheweek 2: The Costs of Breastfeeding
A common argument for breastfeeding is that it's free, but you cannot get something for nothing. There are hidden costs that reflect hidden…
Welcome to #VizOfTheWeek!
Join us every Monday as we share infographics, interactive dashboards, videos and more...