UT Arlington Libraries City of Searches

U T A with star in the center, used when staff photo is unavailable

by Heather Scalf

Related Topics

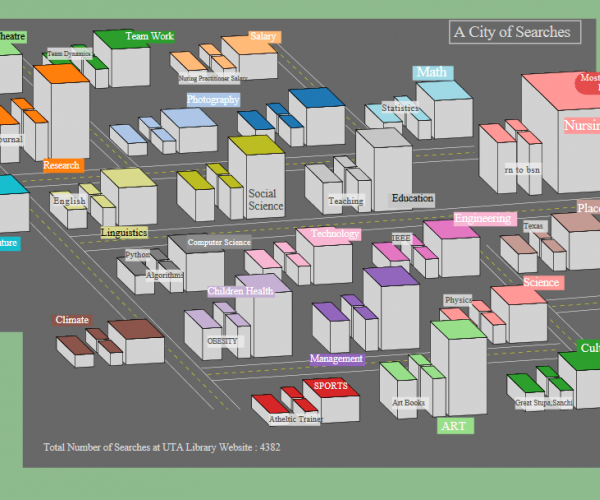
The City of Searches visualization project was inspired by a NISO webinar in September 2018 called Using Analytics to Extract Value from the Library’s Data.  Steven Braun from Northeastern University Libraries shared a visualization that he had created to highlight the Libraries' catalog searches for the previous year.   Pushyahass Reddy Obulapu, a CSE Masters degree student working as a GRA in Libraries Assessment took on the assignment of developing a visualization for the Summon searches for UTA Libraries for the 2017-18 academic year.  

His notes and comments about the project are included below, as well as the resulting visualization.  

Data Visualization of Search Terms at UT Arlington Libraries

  • Students at The University of Texas Arlington Libraries have searched for a wide range of topics at the Libraries website. All the search terms are clustered by category and are visualized as a city, with each category represented as a building block.
  • Each individual building block is scaled dynamically depending upon the frequency of the search category. (Large "buildings"represent more frequently searched topics, small  ones represent less frequently searched topics.)
  • Each sub block represents the most commonly search term in a particular category.
  • This data visualization tells fascinating stories about what students are interested in or searching for at UTA Libraries.
  • The raw search terms are preprocessed and clustered to different categories using pandas and numpy Python Libraries.
  • The clustered data is dynamically visualized using D3.js, a JavaScript Library.
  • Before the start of this project, being a Computer Science graduate student, I had a basic understanding of the D3.js Library and had good hands on experience with python. This project gave me a challenging environment and helped me to apply my programming skills in a broader perspective and in learning D3.js to perform interactive data visualizations more efficiently.

Add new comment

Restricted HTML

  • Allowed HTML tags: <a href hreflang> <em> <strong> <cite> <button> <blockquote cite> <code> <ul type> <ol start type> <li> <dl> <dt> <dd> <h2 id> <h3 id> <h4 id> <h5 id> <h6 id>
  • Lines and paragraphs break automatically.
  • Web page addresses and email addresses turn into links automatically.
CAPTCHA
This question is for testing whether or not you are a human visitor and to prevent automated spam submissions.