Drawing a Map Route for Animation on a Website
(See Francis Woodbridge's Route from Ohio to Mexico City for an example of an animated map route.)
Prepare Your Map Image
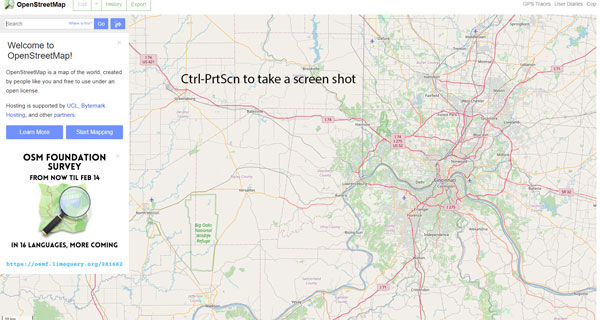
Select a digital map from a source that is owned by UTA or is openly licensed such as Open Street Maps (https://www.openstreetmap.org/). Save an image file of a map or use Ctrl-PrtScn to take a screenshot.
Download the free Inkscape open-source software (https://inkscape.org/)
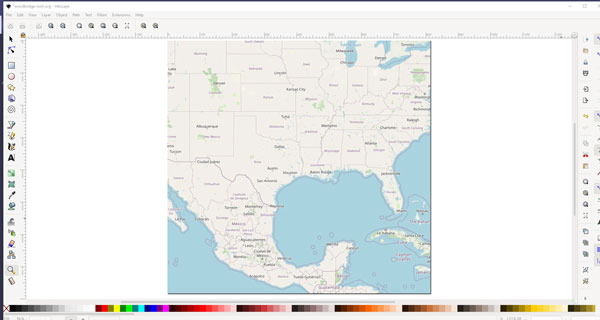
Open your map image in Inkscape or copy/paste the map image into a new Inkscape document.
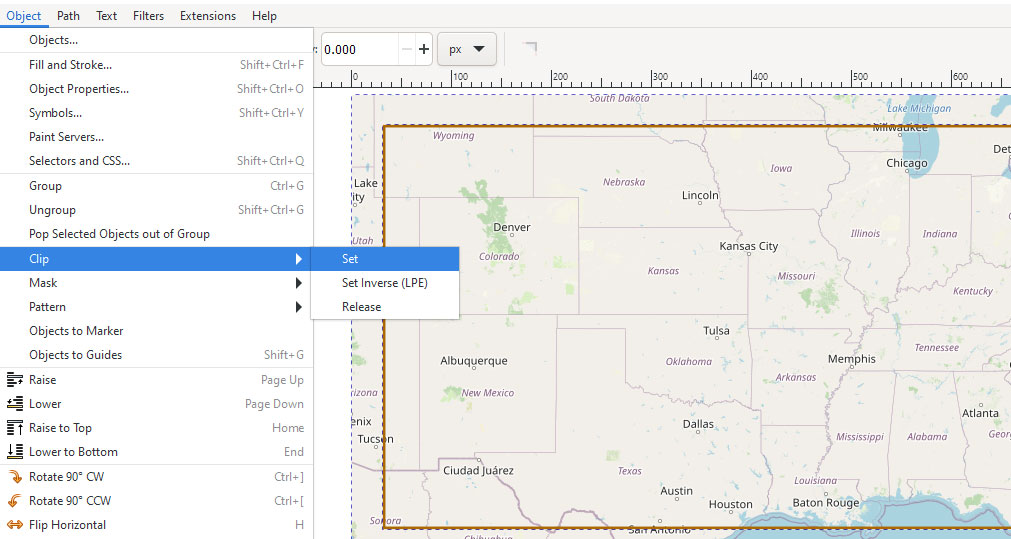
If necessary, crop your image so that only the relevant geographic area is showing:
- With the Rectangle/Square tool, draw a square over the area of the image you’d like to keep and select both the shape and the image (Shift-Select).
- Go to Object > Clip > Set to apply clipping, which crops the image.
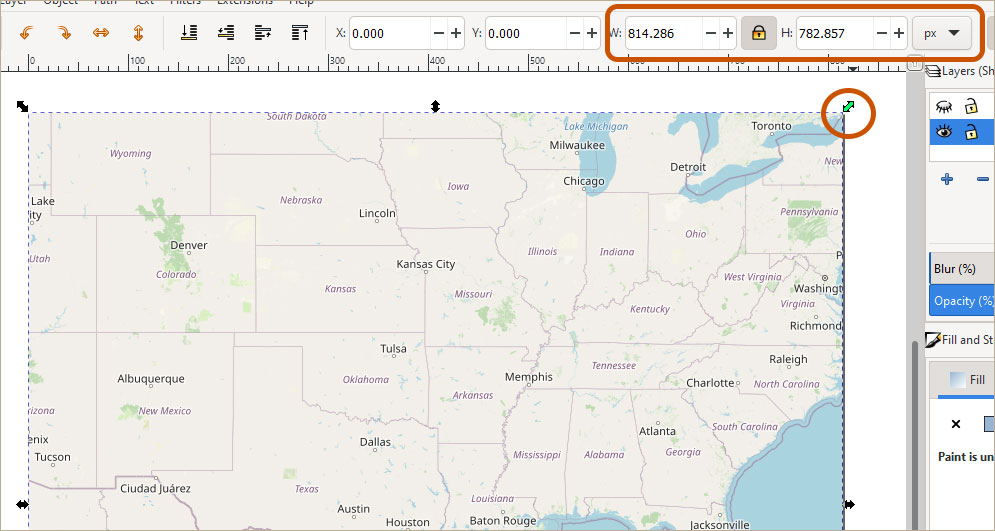
Lock the width/height of the image by clicking the padlock, select the map layer, and drag the corner guide to size the image to not more than 1,000 pixels. Alternately, type the appropriate number in the width box.
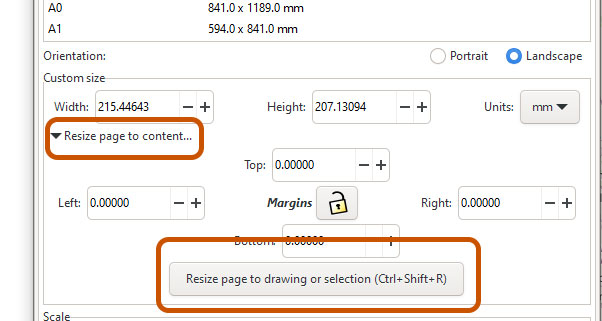
To fit your map to the size of the document, go to File > Document Properties. Under Custom size, click the “Resize page to drawing or selection” button.
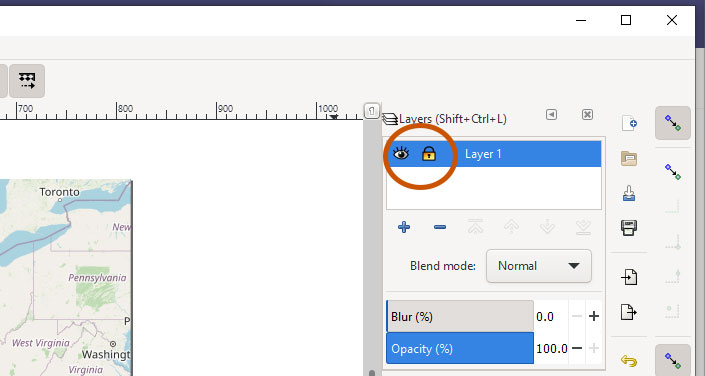
- Open your Layers (Layer > Layers) and lock the map layer by clicking the padlock since we don’t want to edit the map itself but add a new layer on top.
- Save your progress! File > Save (as an Inkscape SVG).
Draw Your Map Route
- Zoom in on the map (View > Zoom or Zoom tool) to see more detail.
- Add a new layer to the document (Layer > Add Layer) and name it something like “Map Route.”
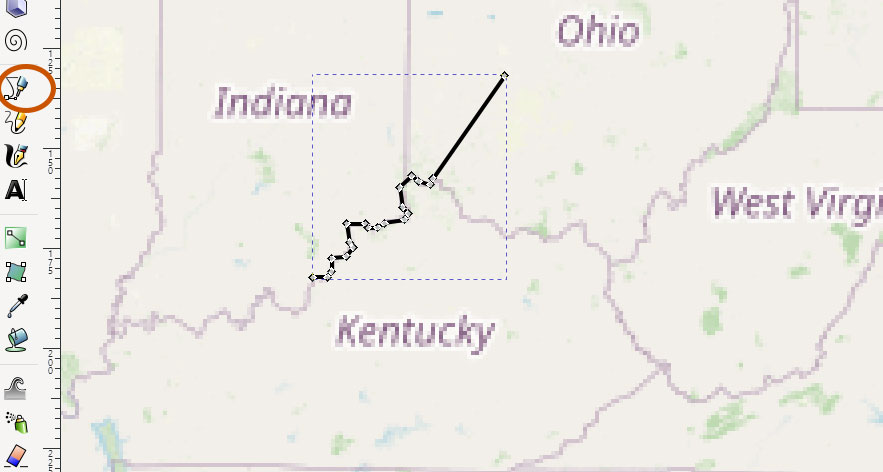
- With the Bezier tool (circled), click on the starting point of your map route and then click again for each segment as the direction of the route changes. It doesn’t have to be exact; we’ll add curves and make adjustments later. Double click at the end of your route to complete the path.
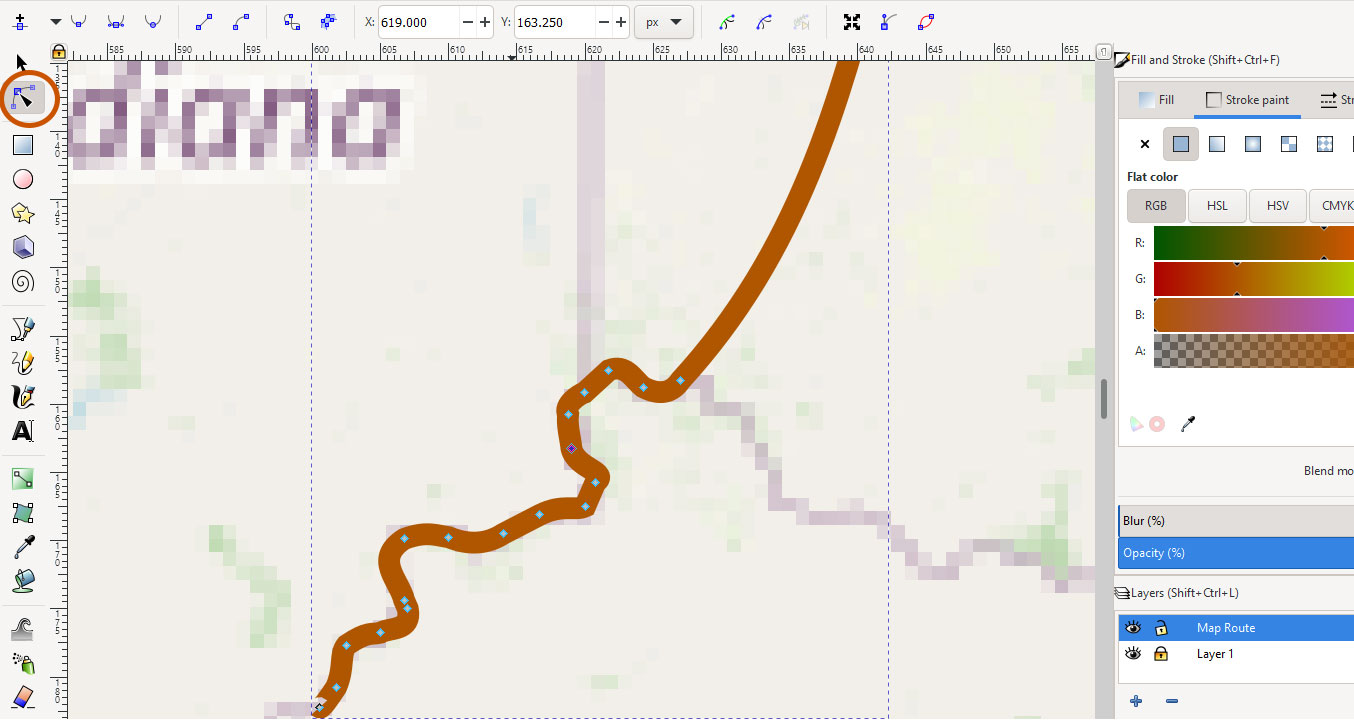
- Select Shift+Ctrl+F to open the Fill and Stroke panel. Choose a color (Stroke paint) and width (Stroke style) for your map route.
- Zoom in further and with the Nodes tool (circled), click and drag the nodes and between the nodes to curve the path along the contours of your route. You can make the route partially transparent (under Stroke paint) to help see the map details underneath your route.
- File > Save
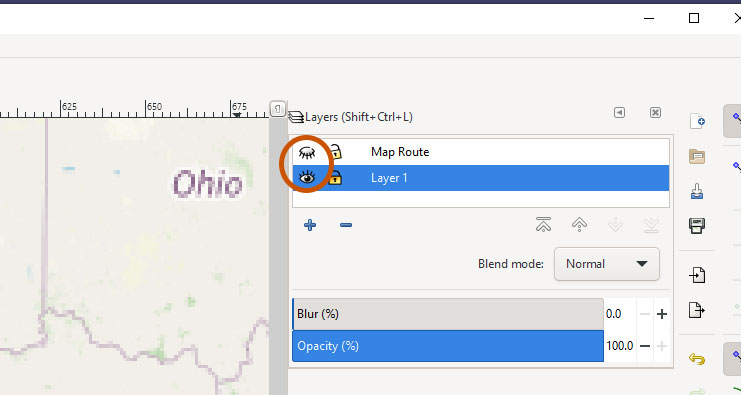
- In the Layers panel, hide your map route layer so that only the map layer is showing.
- Go to File > Export PNG Image. In the Export PNG panel, select your filename/location (Export As) and click the Export button.
- Send the Inkscape SVG file saved earlier and the exported PNG map file to the web developer.
Notes for Web Developer
- The method for using CSS to animate the map route is based on this tutorial:
https://jakearchibald.com/2013/animated-line-drawing-svg/ - The container CSS should be 100% width for responsiveness, with max- and min-width the same as the map. The map is inserted as a background image with no-repeat and background-size: contain.
- Only the SVG path of the map route layer is inserted in the page, not the SVG that’s generated for the background map image.
- Stroke-dasharray lets you specify the length of the rendered part of the line, then the length of the gap. Stroke-dashoffset lets you change where the dasharray starts. If all values begin at the full length of the line, we can use CSS transition to decrease the dashoffset to zero over a specified amount of time, which makes it appear as if the line is being drawn.
- The JavaScript triggered with a button click gets the length of the path, which it uses to set the values described above. It then uses getBoundingClientRect to trigger a layout, because if you modify a style twice (dashoffset from full length to zero) in the same JavaScript execution without forcing a synchronous layout in between, only the last one counts.