Data Visualization Literacy: A Need, A Language, and A Process
Learn to make data visualizations that are concise, accurate, and complete. Learn to identify why certain charts are better than others and how…
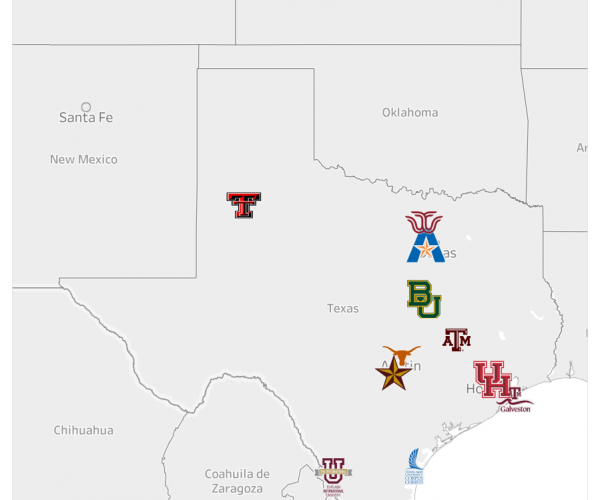
#vizoftheweek 13: Mavs Dataverse
UTA Mavs Dataverse is a member of the Texas Data Repository (TDR), a consortium of nine Texas academic libraries. Mavs Dataverse serves as an open…
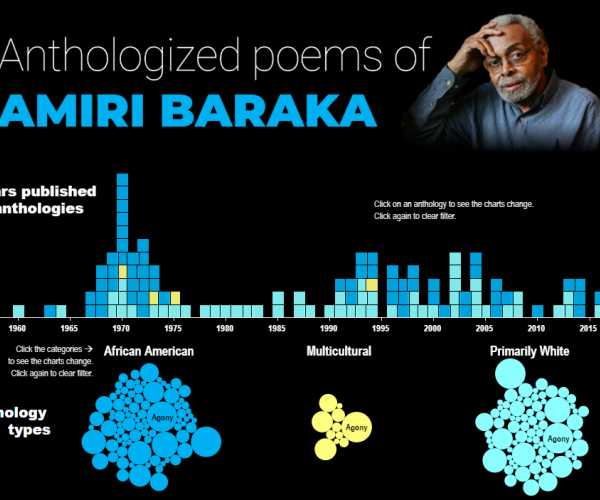
#vizoftheweek 11: Amiri Baraka, Poetry and Anthology Data
Why build a dataset on Amiri Baraka? Dr. Howard Rambsy explains the process of studying literary history using digital tools.
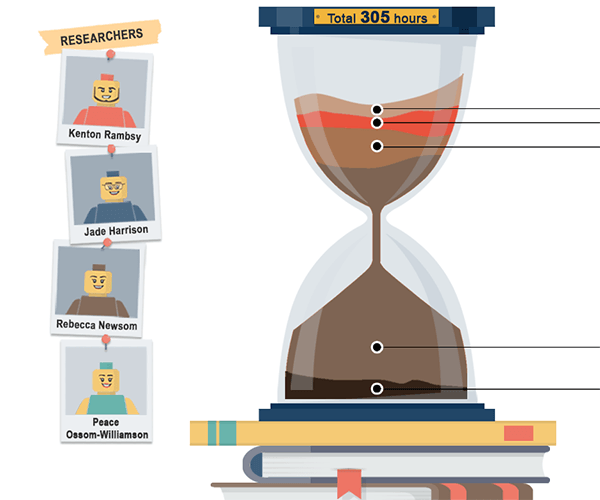
#vizoftheweek 6: Labor and Digital Humanities
Have you ever seen a digital humanities project that interested you, but you didn’t know what it took to create it? This #vizoftheweek breaks down…
Data Structuring for DH Mapping
But what is a dataset in the humanities? Can you make one? If you think about “data” as meaning “information,” yes, you can.