
The Future of Urban Planning at UTA Libraries: Kukhyoung Kim
When Kukhyoung Kim applied for her graduate research associate (GRA) position at the University of Texas at Arlington Libraries, she was looking…
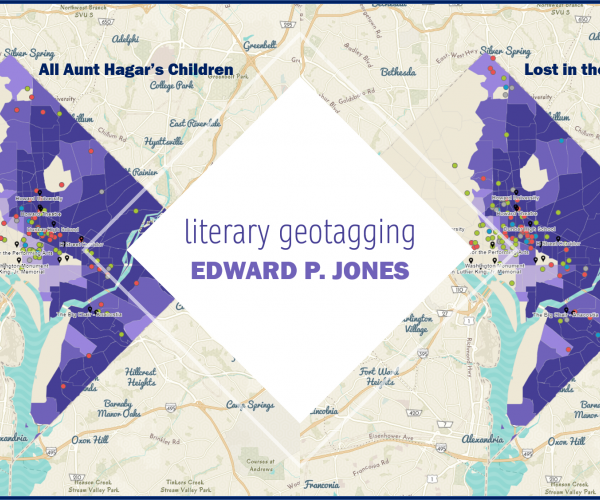
#vizoftheweek 15: Literary Geotagging - Edward P. Jones and Spatial Storytelling, Part II
For the final #vizoftheweek, read the second of 2 posts about how locations in Washington, D.C. were analyzed in stories by Edward P. Jones.
Finding Inspiration for Digital Humanities and Data Visualization Projects
Looking at other projects can give you ideas about potential research topics, research methods, visualization style, or more.
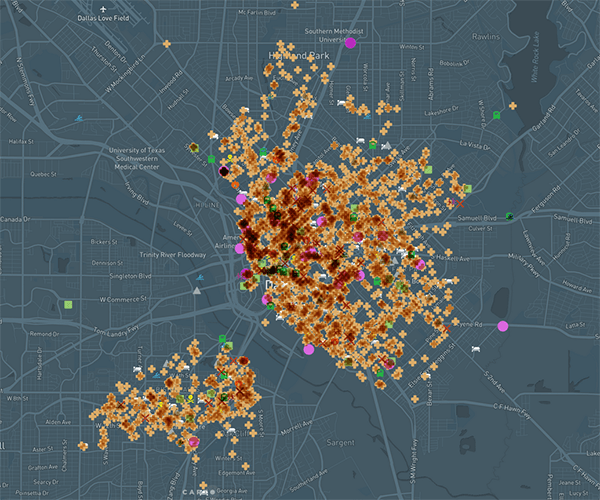
#vizoftheweek 14: Dallas Death Map
Have you ever wondered which parts of the Dallas area are “haunted”? An interactive map created at UTA Libraries lets you do just that.
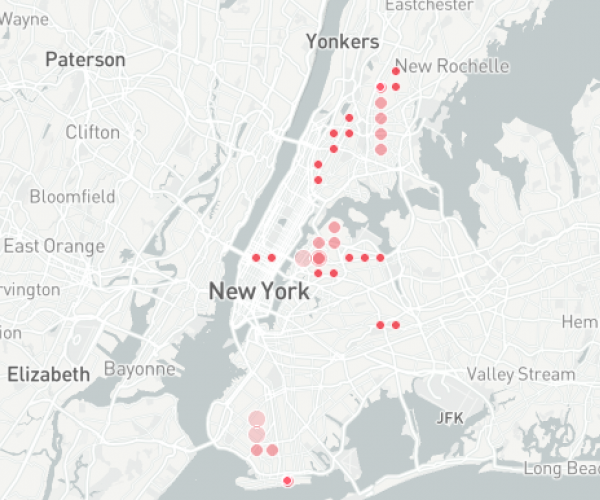
#vizoftheweek 12: Subway Growth and Transit Deserts in NYC
While New York City’s subway system is famous, New Yorkers living in the outer boroughs of the city also face the reality of transit deserts.
Using Shapefiles in Tableau
After exploring shapefiles in Tableau, I created an exercise to test it out using COVID-19 data.
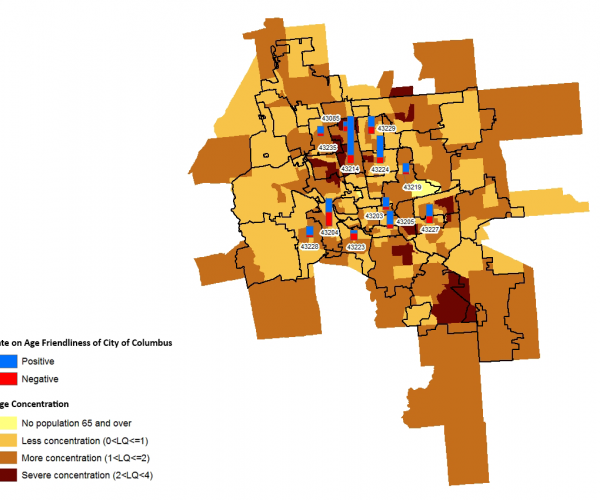
#vizfotheweek 10: Age Friendliness in a community’s characteristics
This blog post is about use of GIS in research. The study identified the relationships between socio-economic demographic characteristics of…
Research Data Services in Support of New Campus Needs
Do you work with data? Then we have services and resources to help you. For quantitative and qualitative analysis, our UTA Libraries' Research…