by Peace Ossom Williamson


by Peace Ossom Williamson
This is our last #vizoftheweek, and we hope you have enjoyed all our posts. To read the entire collection, visit libraries.uta.edu/vizoftheweek.
For our final post, read about how locations in Washington, D.C. were analyzed in stories by Edward P. Jones. This is Part II of the 2-part topic (read Part I). Guest post by Dr. Kenton Rambsy, Assistant Professor of African American Literature and Digital Humanities:
I taught ENGL 5324: Lost in the City, a graduate-level African American literature course in fall 2017. In this course, we explored Edward P. Jones’s consistent use of Washington, D.C. as a setting in two collections, Lost in the City (1992) and All Aunt Hagar’s Children (2006). Collectively, the 28 stories from these two collections shed new light on the development of short fiction in the contemporary era and the significance of Washington, D.C. in the literary imagination of a Black writer.
Because of the literary geotagging – i.e., highlighting geographic markers and racial-spatial dimensions of the city, my students and I created a dataset identifying all of the locations in the stories: We were able to document how often certain streets were mentioned and what quadrants most of Jones’s stories were set in. For instance, the Northwest quadrant, which is the largest quadrant and includes many notable landmarks such as the National Mall, Smithsonian Museums, and Howard and Georgetown Universities, is a primary focus for Jones, as he made nearly 400 place-based references to locales in this area.
Despite the long history and dense population of African Americans living in or near the nation’s capital, the predominately black quadrants of Washington D.C., have a relatively small presence in the scholarship on African American literature. What Edward P. Jones perceived as a lack of knowledge about D.C. motivated the nature of his stories. In an interview with Dan Rivas, Jones explained, “I was in college and was shocked at the ignorance of my fellow students about life in D.C. They knew only that it was the seat of government.” Commenting on his first collection of short stories, Lost in the City, Jones continues, “The stories, over two decades, came with my effort to set the record straight. D.C. is a place of neighbors where people do good and bad things to each other, just as they do in Dubuque and Seattle and Worcester.”
Jones was interested in offering a perspective that reflected his coming of age experiences in the city, as he remarks, “We lived in a black world and had little to do with white people in the rest of D.C.” Not surprising given his interests, Jones’s incorporates numerous streets and landmarks, in order to present views of the District beyond governmental and national politics. His work constitutes one of the most outstanding, data-rich treatments of places and spaces in the history of African American literature.
Over the last few decades, however, D.C. has witnessed a significant decrease in African American residents due to the rising costs in rent brought on by gentrification efforts. According to David Rusk, D.C. is no longer “Chocolate City” (a nickname for Washington, D.C. because of its large African American population): In 1970, DC had a majority Black population at 71.1%, with White people making up 27.7% of the District’s population and Hispanic people making up 2.1%. By 2015, the population of D.C. was 48% Black, 35.6% White, 10.2% Hispanic, 3.6% Asian, and 2.6% mixed race and other races.
Since Jones’s stories are not set in present-day Washington, D.C., his references to specific landmarks serve as indicators giving insight into the decade of each story. Jones’s stories act as a cultural reservoir of sorts by incorporating key locations from distinct periods in D.C.’s geographic history. This type of information helps us to consider the extent to which D.C.’s landscape has changed over time.
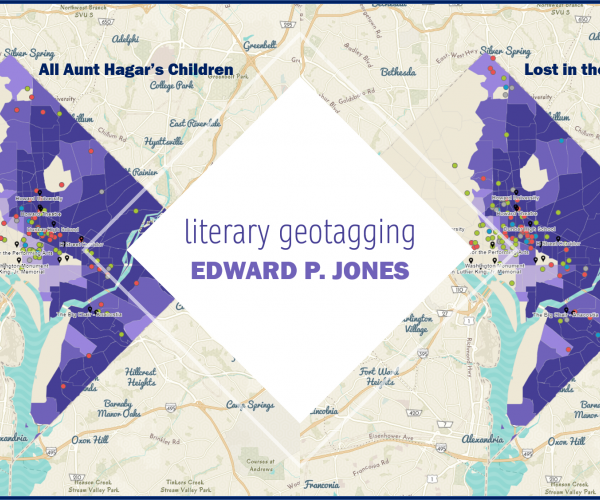
After my students and I created the dataset of locations mentioned in Edward P. Jones's stories in the two collections, I collaborated with Kukhyoung Kim, GIS GRA of the UTA Libraries’ DataCAVE. We combined this dataset with public census records in order to create interactive ArcGIS maps that overlay real-life population changes in D.C. with the locations Jones references in his short fiction. These maps can serve as a guide where readers can understand the historical dimensions of his stories.
The maps display the locations mentioned in each collection. Purple shading shows the percentage of the population that was Black or African American in 1970, with darker areas having a higher percentage of Black people.
Locations: The locations mentioned are displayed by category where
Landmarks: Washington, D.C. landmarks are pinned with black icons along with the locations. These include notable landmarks, like the U.S. Capitol and the Washington Monument.
Add new comment