
by Isaac Williams
by Isaac Williams
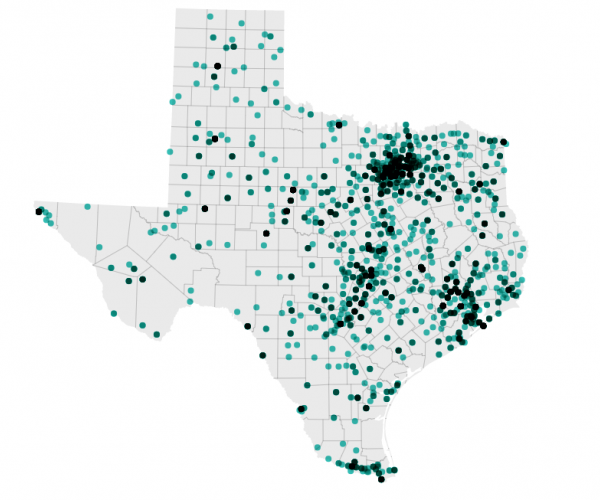
This week, I decided to learn a new data visualization tool: Datawrapper. What better dataset to try it out with than the UFO sightings dataset I’ve used for Tableau workshops this year?
This dataset is part of a larger dataset maintained by the National UFO Reporting Center. The original dataset contains many, many UFO sightings from around the United States, and includes a lot of information about these experiences. To make the dataset more manageable for an introductory workshop, I cut out all sightings except those that occurred in Texas.
Datawrapper is a different tool than Tableau or Carto, which I typically use when mapping (the Dallas Death Map was made in Carto). Datawrapper is entirely browser-based, meaning there is no desktop version to download. It’s also free to use, and users don’t need to make an account to use it.
In Datawrapper, users can make three types of maps: choropleth, symbol, and locator. Each map type has its own data requirements. Putting your data into a spreadsheet with either address or latitude/longitude columns is a good place to start. There are many options of basemaps, colors, and more. Maps can be easily shared to social media, or embedded on a personal website.
Within a relatively short amount of time, I was able to upload my dataset (as a CSV), customize my map, attribute my data source, make the map shareable, and publish the map. You can visit the Texas UFO Sightings Map here.
Some tips for working with Datawrapper:
Next steps:
Add new comment