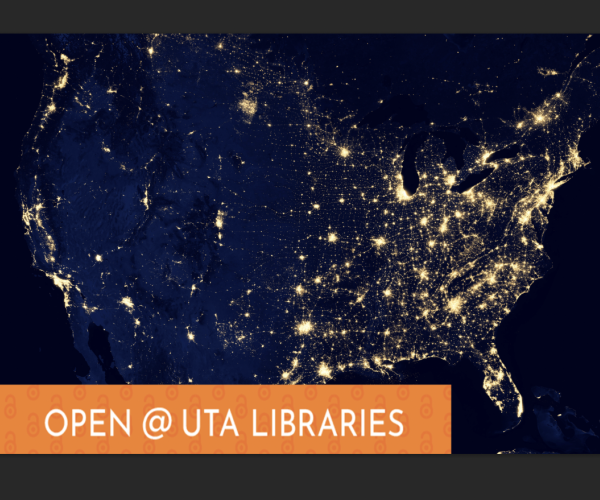
Open Access Week
UTA Libraries is celebrating the open sharing of knowledge during Open Access Week from Oct. 23 to Oct. 27. The library will host several events…
Data Visualization Literacy: A Need, A Language, and A Process
Learn to make data visualizations that are concise, accurate, and complete. Learn to identify why certain charts are better than others and how…
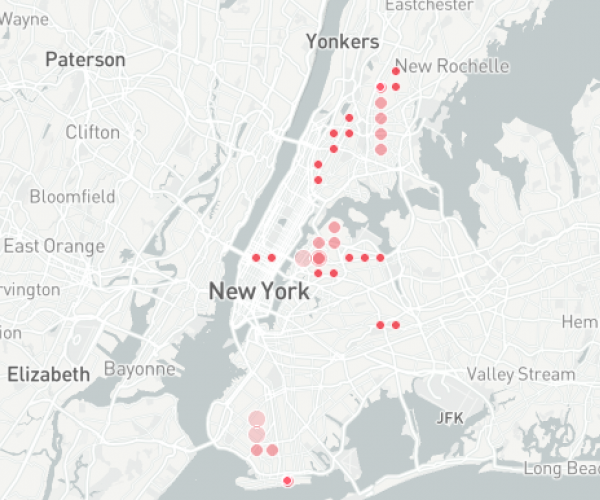
#vizoftheweek 12: Subway Growth and Transit Deserts in NYC
While New York City’s subway system is famous, New Yorkers living in the outer boroughs of the city also face the reality of transit deserts.
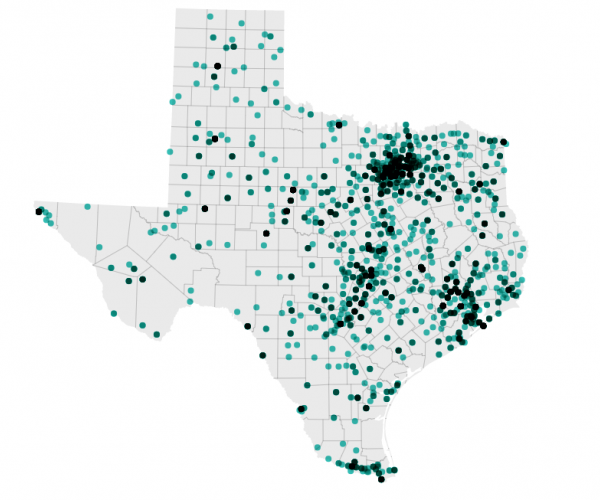
Mapping with Datawrapper: Texas UFO Sightings Map
This week, I decided to learn a new data visualization tool: Datawrapper. What better dataset to try it out with than the UFO sightings dataset I’…
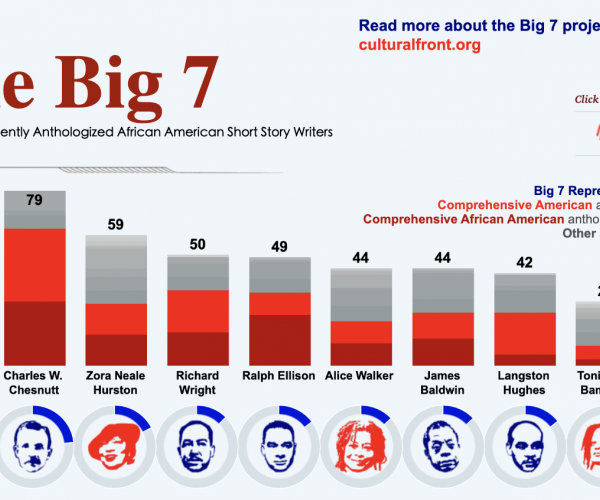
#vizoftheweek 5: Quantifying the Circulation History of African American Short-Story Authors
Standard literary histories, which emphasize key dates and moments, sometimes minimize subtle but important developing patterns, which take shape…