
by Peace Ossom Williamson
by Peace Ossom Williamson
This week, read about how locations in Washington, D.C. were analyzed in stories by Edward P. Jones. This 2-part topic will continue the week after Spring Break. Guest post by Dr. Kenton Rambsy, Assistant Professor of African American Literature and Digital Humanities:
Edward P. Jones is an author with a specific feature in his writing, which is his inclination to highlight so many geographic markers is a form of literary geotagging, where racial-spatial dimensions of the city in his stories provides multiple renderings of Washington, D.C. and thereby offers diverse representations of black men and their experiences in a select geographic region. For years now, I have been trying to utilize cultural geo-tagging as a method to enhance some of my examinations of literature. Collecting data related to Jones’s short fiction helps us to better define and visualize the parameters of Jones’s D.C.
Every Wed. I'm going to use Twitter to highlight a Black DH project & briefly state how it embodies Black DH principles. Lost in the City - https://t.co/A90iQMPAt7 -it innovatively maps & visualizes the relationship between black humanity & physical space - @krambsy @123POW
— Kim Gallon (@BlackDigitalHum) January 1, 2020
In fall 2017, I taught ENGL 5324: Lost in the City, an African American literature course. In this course, we explored Edward P. Jones’s consistent use of Washington, D.C. as a setting in two collections, Lost in the City (1992) and All Aunt Hagar’s Children (2006) and created a dataset that identified all of the locations in these collections’ stories. Collectively, these 28 stories shed new light on the development of short fiction in the contemporary era and the significance of Washington, D.C. in the literary imagination of a Black writer. We were able to document how often certain streets were mentioned and what quadrants most of Jones’s stories were set in. For instance, the Northwest quadrant is a primary focus for Jones: He makes nearly 400 place-based references to locales in this area of the city.
The Northwest quadrant is the largest of the four quadrants and includes many notable landmarks of D.C., such as the National Mall, numerous Smithsonian Museums, and several institutions of higher learning such as Howard and Georgetown universities. The Northwest quadrant includes Fifth to Eighth streets, New Jersey and New York Avenues, and M Street and North Capital. By mentioning so many well-known and specific places, Jones acts as a cartographer of sorts in his literary mapping of D.C. He utilizes these locations and populates them with African American characters not by happenstance. Instead, he composes narratives to deliberately highlight places where African Americans live and interact with each other in the city.
As a result of this data collection effort, I collaborated with UTA Libraries’ dataCAVE to create several visualizations related to Jones’s short fiction. The first visualization highlighted this week was created in Tableau Public by Peace Ossom-Williamson and subsequent maps created by Kukhyoung Kim will be highlighted in our next post. These visualizations appear in the edited text Lost in the City: An Exploration of Edward P. Jones's Short Fiction published by the University of Illinois Urbana-Champagne’s “Publishing Without Walls Digital Initiative.” Overall, this visualization helps us to uncover the types of locales Jones incorporates into his fictional renderings of D.C.
In this dashboard are charts of the places compiled from the 28 stories; the various shades of green represent each of DC’s four quadrants.
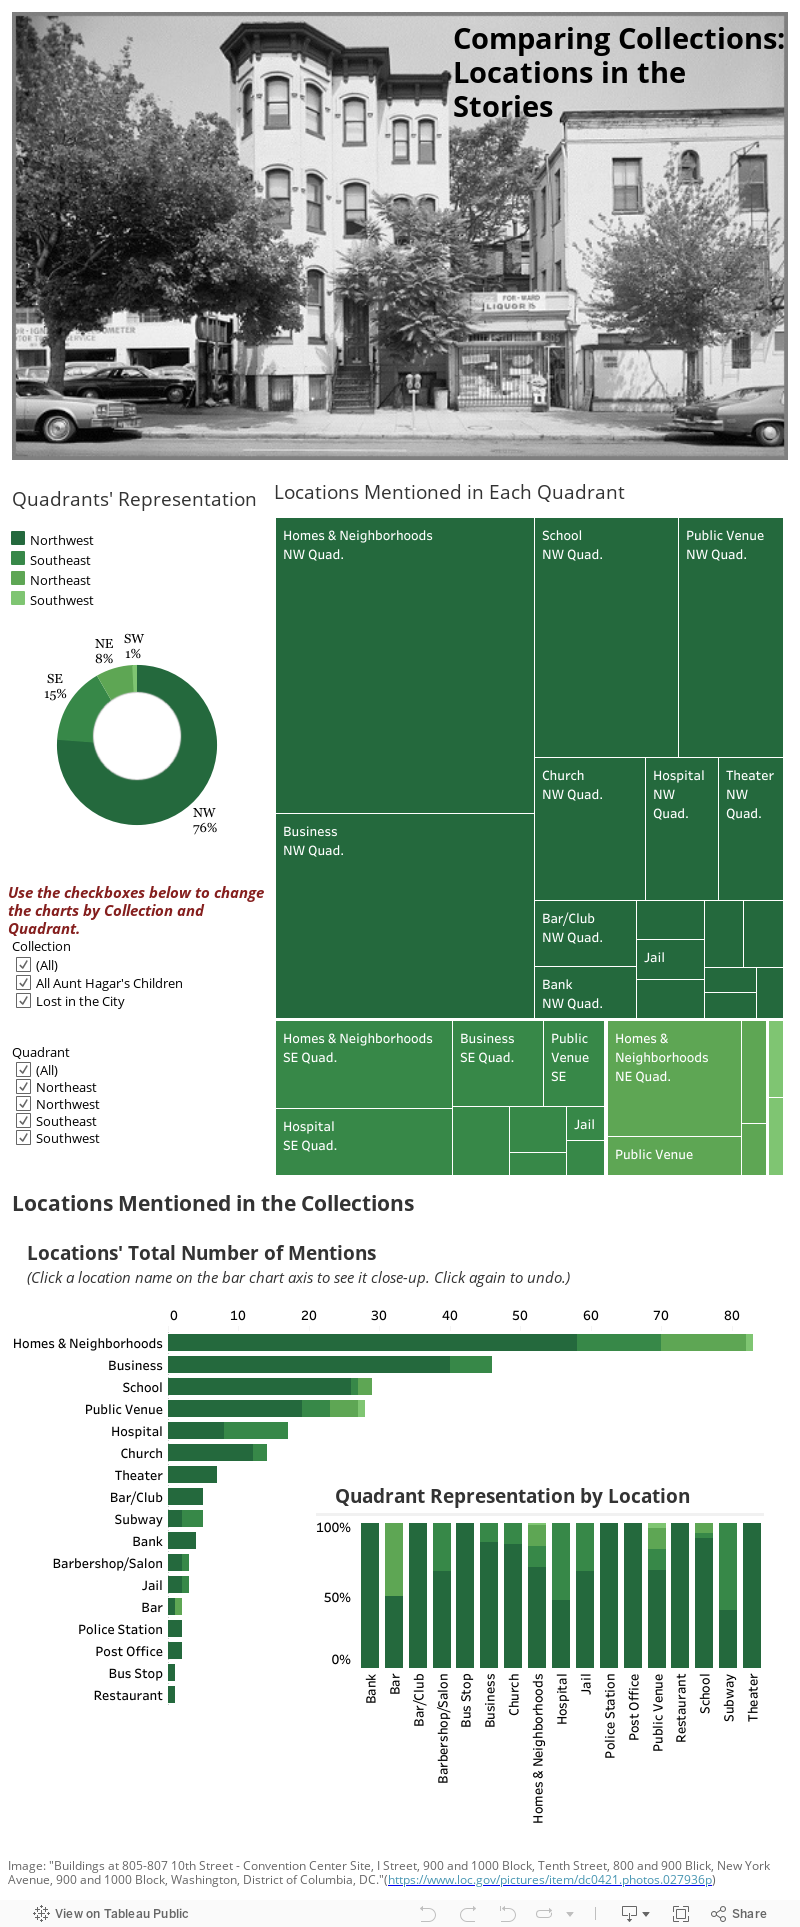
Dashboard Creator: Kenton Rambsy & Peace Ossom-Williamson. Copyright: Creative Commons Attribution 4.0 International (CC BY 4.0)
NOTE: #VizOfTheWeek is skipping Spring Break and will be back on March 23rd!
Add new comment